
This basic tutorials explain how to use the Sefaria API to create a few possible data visualizations.
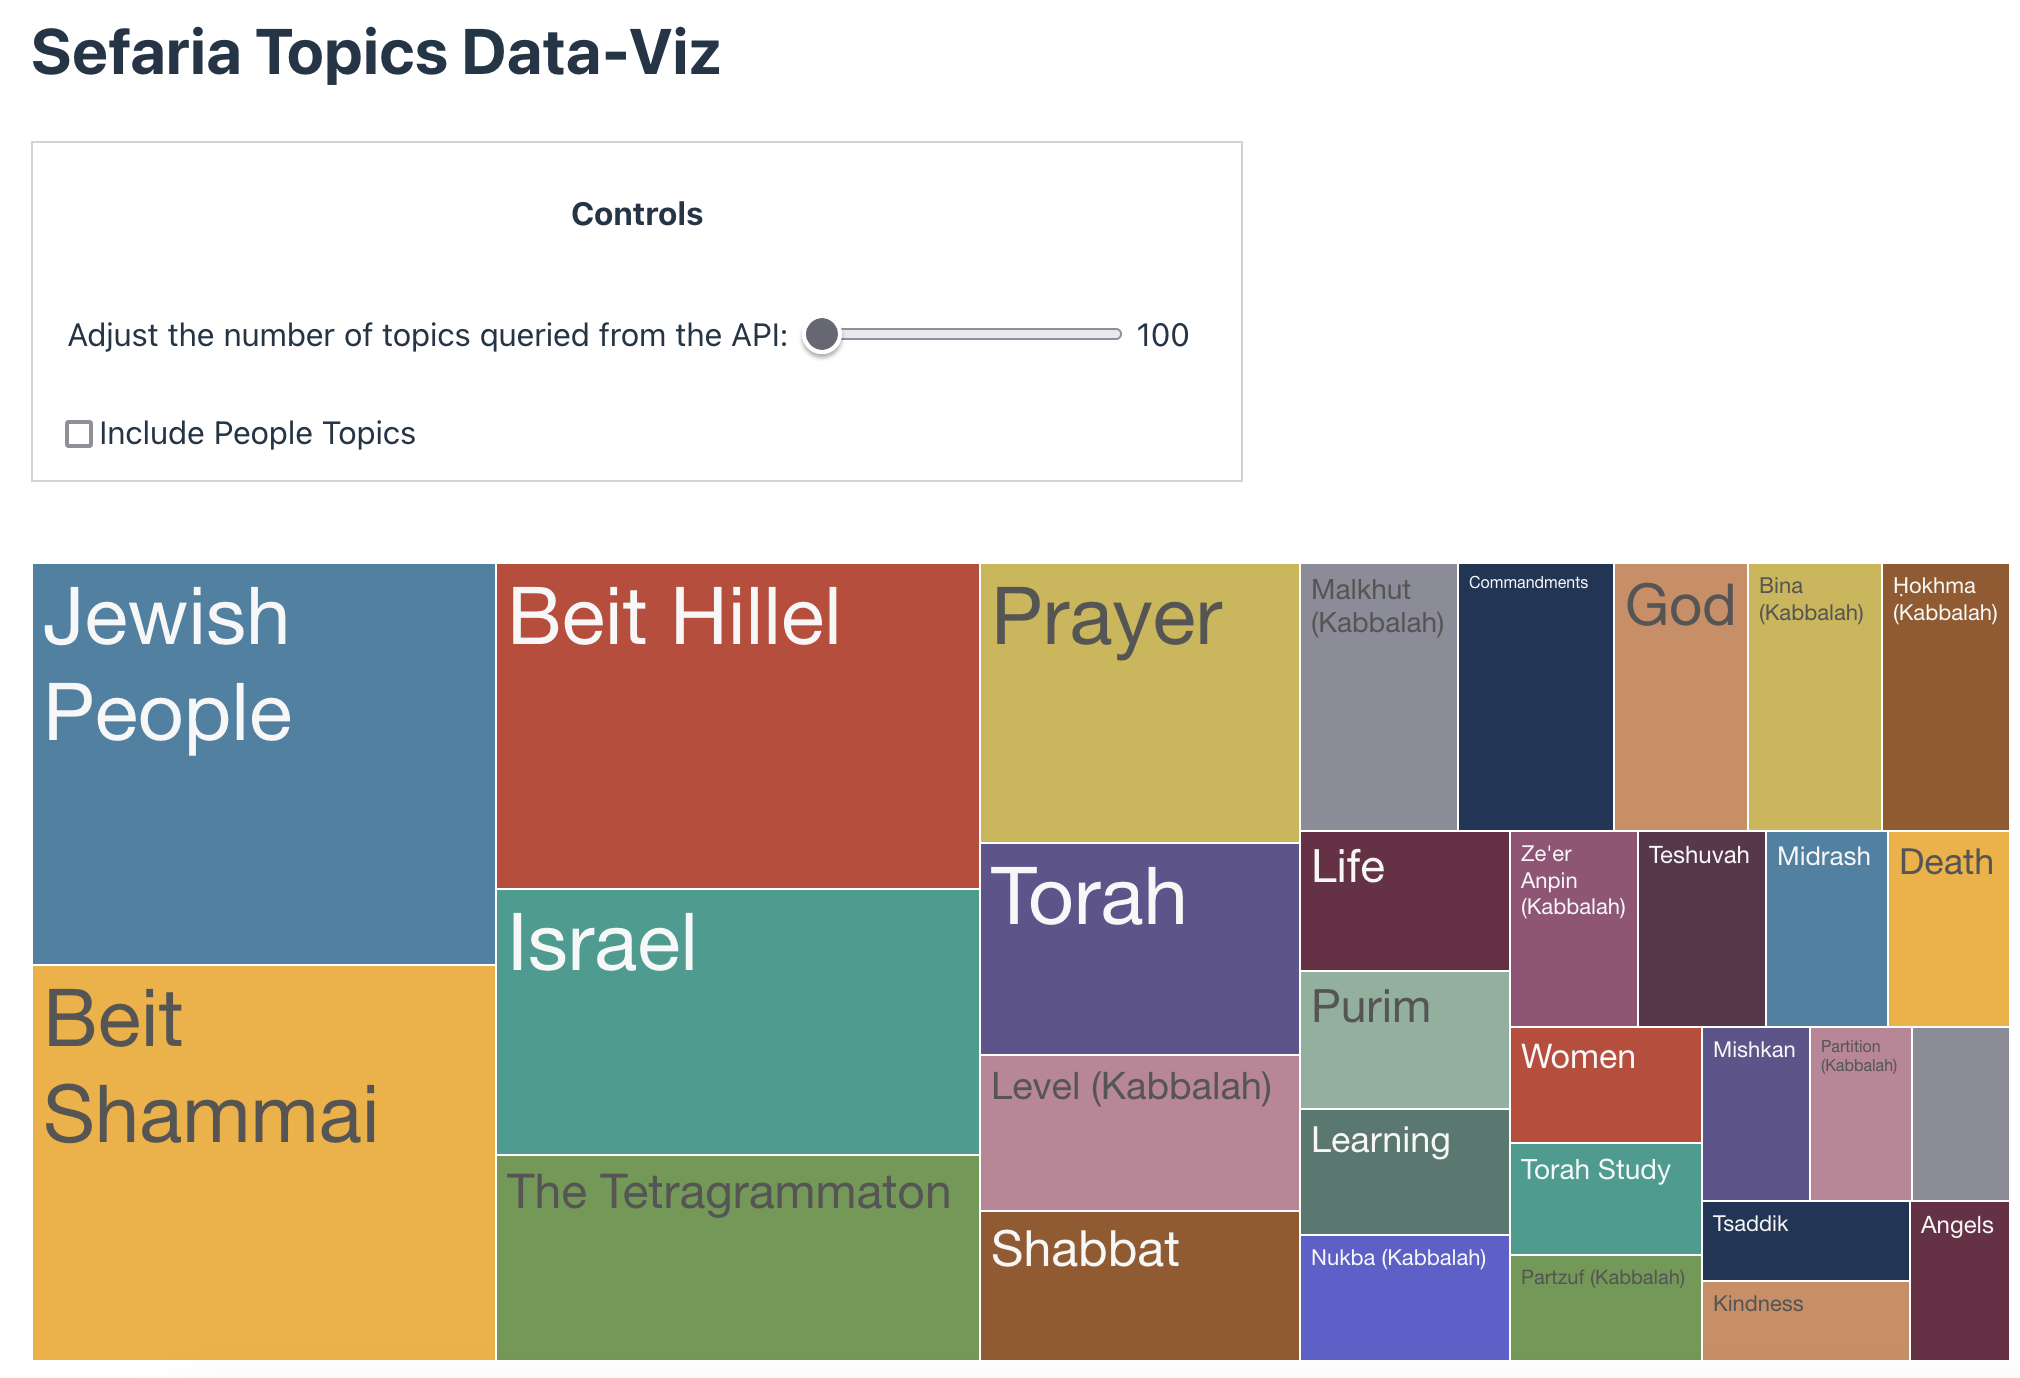
A Topics Treemap
In this tutorial, we're going to using the Topics API to build a basic data visualization using D3Plus.
You can see the entire repository here.
Tutorial Setup: React
This tutorial uses React. Get started with the following steps:
1. Creating the App
First, ensure you have Node installed. We'll be using Vite to create the basic template for the React app:
- Run
npx create-vite@latest <name-of-app> --template react - Then,
cd <name-of-app> - Install your dependencies via
npm install - Run the app via
npm run dev
You should see something running at http://localhost:5173/.
2. Install D3Plus for React
This tutorial use the D3Plus library to generate a data visualization. In order to get the required D3Plus packages, run npm install d3plus-text and npm install d3plus-react.
Please note: This tutorial will focus only on the code we wrote in App.jsx, the main body of the application. In addition to the code described here, we made some other tweaks for styling and streamlining purposes. In order to see those, visit the full GitHub repository containing this project here. The README also includes notes for running the project locally.
This tutorial will review the file line by line. In order to see everything together check out the repo or scroll to the bottom of this page.
Building the Visualization
Seeing as Vite provides templated content for App.jsx, the first step is to delete the entire contents of the provided file. The default content will be replaced with the code below.
Imports
At the top of your file, add the necessary imports. We need the useEffect and useState, two React hooks, and the Treemap visualization from D3Plus.
import { useEffect, useState } from "react";
import {Treemap} from "d3plus-react";
Component StructureFor the sake of simplicity and for the flow of a tutorial (where text is interwoven with code) we chose to keep everything together, as one big component. It would be better, however, if each aspect of the page was created as its own component and rendered inside of the
<App />component.
useState() Hooks
The following description assumes basic knowledge of React and React hooks. If you're new to these, feel free to check out the linked documentation above to learn more before continuing with the tutorial.
Start by setting up the top of your component with your state hooks.
const [data, setData] = useState([]);
const [limit, setLimit] = useState(100);
const [includePeopleTopics, setIncludePeopleTopics] = useState(false);
As you continue, you will need to track three things:
- The
datafrom the API - The
limit: This is a query parameter for the API describing how many topics we want returned from the query. - A boolean
includePeopleTopics: Seeing as some topics with a subclass ofpersonhave an overwhelming amount of sources linked to them, this offers users the ability to toggle between displaying those topics or not as part of the treemap.
API Call and Data Processing
The Topics API
At a high level, the Topics API returns a list of topics from the Sefaria Library. Below is a JSON focusing on a single topic, showcasing the data we have to work with.
[
  {
    "slug": "rabbi-yochanan-b-napacha",
    "titles": [...], // Commented out for brevity
    "subclass": "person",
    "alt_ids": {...}, // Commented out for brevity
    "properties": {...}, // Commented out for brevity
    "description": {
      "en": "R. Yochanan studied under R. Yehudah haNasi and emerged as the next leader after his death. He directed the academy in Tiberias and set up the groundwork for the Jerusalem Talmud. His unusual beauty, sharpness and personal sufferings made him a captivating yet intimidating teacher. It was due to his personality and his unrivaled learning that the center of Torah study did not move to Babylonia during his lifetime.",
      "he": "רבי יוחנן למד עם רבי יהודה הנשיא והיה למנהיג הבא אחרי מותו. עמד בראש הסנהדרין בטבריה והכין את היסודות לתלמוד הירושלמי. יופיו החריג, חריפותו וסבלו האישי עשו אותו למורה שובה אך מאיים. בשל אישיותו ותלמודו המעולה, לא עבר מרכז לימוד התורה לבבל במשך חייו."
    },
    "categoryDescription": {},
    "numSources": 24590,
    "description_published": true,
    "primaryTitle": {
      "en": "Rabbi Yochanan b. Napacha",
      "he": "רבי יוחנן"
    }
  }
]
For this use case, the most important data are the primary English title of the topic (or the numSources field) which indicates the number of Sefaria Library sources linked to the topic and the subclass, which will be crucial for allowing users the option to view non-people topics only.
With this information at hand, we can return to the code.
UseEffect
This section of the tutorial includes three steps:
- Inside of our
useEffecthook, we make a call to the Topics API. IfincludePeopleTopicsisfalse, we filter out any topic with a subclass ofperson. Otherwise, the people topics will remain present in the returned data. - After making a call, we use a
mapfunction to create an array of objects with the fieldtitleandnumSources. - Finally, we use our
setDatahook to set this filtered and mapped data in ourdatastate.
  useEffect(() => {
    fetch(`https://www.sefaria.org/api/topics?limit=${limit}`)
      .then((res) => res.json())
      .then((res) => {
        if (res) {
          const filteredData = res
          .filter((topic) => includePeopleTopics || !(topic.subclass && topic.subclass === "person"))
          .map((topic) => ({
            title: topic.primaryTitle?.en,
            numSources: topic.numSources
          }));

          setData(filteredData);
        }
      })
      .catch((err) => console.error(err));
  }, [limit, includePeopleTopics]);
This useEffect is set to re-render any time there's a change in limit or includePeopleTopics, two values we allow the users to toggle in the controls.
Returning JSX
Once we have all that set up, it's time to return our JSX! After setting up some controls for the user we can render the visualization. As noted above, these would ideally be separated into sub-components but, for the sake of the tutorial, have been kept together.
The User Controls
Inside our user controls is a range toggle that allows users to set the limit on the number of topics they'd like returned from the API. On change, we call our setLimit hook and change the limit to the value targeted by the user. As mentioned above, any change to limit triggers useEffect to run, querying the API again and refreshing the data.
<h1>Sefaria Topics Data-Viz</h1>
	<div className="controls">
		<h4 className="centered">Controls</h4>
			<div>
				<span>Adjust the number of topics queried from the API: </span>
					<input
              type="range"
              min="100"
              max="5000"
              value={limit}
              step="100"
              onChange={(e) => setLimit(Number(e.target.value))}
            />
         <span>{limit}</span>
        </div>
Afterwards, we also create a checkbox for users to toggle in order to indicate whether they would like the "people" topics to be included in the display or not:
        <div>
          <label>
            <input
              type="checkbox"
              checked={includePeopleTopics}
              onChange={() => setIncludePeopleTopics(!includePeopleTopics)}
             />
            Include People Topics
           </label>
        </div>
When this checkbox is checked (or unchecked) the callback function calls our setIncludePeopleTopics hook to true or false. As mentioned above, any change to limit triggers useEffect to run, refreshing the data by re-running it through the conditional filtering.
The Visualization
Beneath the controls, we render the visualization. One nice thing about D3Plus is how it provides an out-of-the-box React component without requiring any detailed work on D3 configuration. All we need to do is pass in our data and set the config the way we'd like it to get the desired result. See below:
<Treemap config={{
			data: data,
      groupBy: "title",
      sum: "numSources",
      height: 400,
      width: 1200,
      shapeConfig: {
      	label: d => {
                return [d.title];
              },
       },
       tooltipConfig: {
              tbody: (d) => [
                ["Linked Sources:", d.numSources]
              ]
      },
}} />
The <Treemap/> component takes one prop, config, in which we can pass the data and set the configurations. You'll see we pass in the data, ask to group the topics by their title, and create the area value on the map based on the sum of the numSources.
The next few lines arrange the desired height and width of the visualization, as well as overriding some defaults to make things clean and presentable. For example,shapeConfig allows us to hide percentage values, which make less sense in this case, and tooltipConfig does the same but in the context of the hoverable tooltip.
Congratulations!You've officially built your first data visualization using data from the Sefaria API!
Taking it Further
This example is extremely bare-bones, meant only as a proof of concept. Can you take this example and expand? We'd love to see what you create!
Some possibilities:
- Experimenting with the use of different visualizations
- Experimenting with a different visualization library
- Experimenting with different API endpoints, what's most the most useful visualization you can make based on the Jewish canon?
If you build something, let us know! We love seeing all of the projects powered by our data.
Full Code
To see the full repository, including style changes and other clean up, see here.
To see the entirety of the App.jsx file we built, see below:
import { useEffect, useState } from "react";
import {Treemap} from "d3plus-react";

function App() {
  const [data, setData] = useState([]);
  const [limit, setLimit] = useState(100);
  const [includePeopleTopics, setIncludePeopleTopics] = useState(false);

  useEffect(() => {
    fetch(`https://www.sefaria.org/api/topics?limit=${limit}`)
      .then((res) => res.json())
      .then((res) => {
        if (res) {
          const filteredData = res
          .filter((topic) => includePeopleTopics || !(topic.subclass && topic.subclass === "person"))
          .map((topic) => ({
            title: topic.primaryTitle?.en,
            numSources: topic.numSources
          }));

          setData(filteredData);
        }
      })
      .catch((err) => console.error(err));
  }, [limit, includePeopleTopics]);

  return (
    <>
        <h1>Sefaria Topics Data-Viz</h1>
        <div className="controls">
          <h4 className="centered">Controls</h4>
          <div>
            <span>Adjust the number of topics queried from the API: </span>
            <input
              type="range"
              min="100"
              max="5000"
              value={limit}
              step="100"
              onChange={(e) => setLimit(Number(e.target.value))}
            />
            <span>{limit}</span>
          </div>
          <div>
            <label>
              <input
                type="checkbox"
                checked={includePeopleTopics}
                onChange={() => setIncludePeopleTopics(!includePeopleTopics)}
              />
              Include People Topics
            </label>
          </div>
        </div>

        <div className="viz">
          {data.length > 0 ? (
          <Treemap config={{
            data: data,
            groupBy: "title",
            sum: "numSources",
            height: 400,
            width: 1200,
            shapeConfig: {
              label: d => {
                return [d.title];
              },
            },
            tooltipConfig: {
              tbody: (d) => [
                ["Linked Sources:", d.numSources]
              ]
            },
          }} />
          ) : (
            <p>Loading...</p>
          )}
        </div>
      </>
  );
}

export default App;